As an extension of the evaluation of already available condition data, an image analysis based on the images acquired during individual measurement runs, such as the georadar measurements, has now been integrated. The results of the image analysis have been integrated into the main view BSG-NET1 as an additional data channel and are now part of the module 3 „Fractal analysis and image analysis“ of BSG-Infra. In image analysis, search criteria can be freely defined. This applies to both, the object to be recognized and the image section in which the search is to be carried out.
Detecting of vegetation
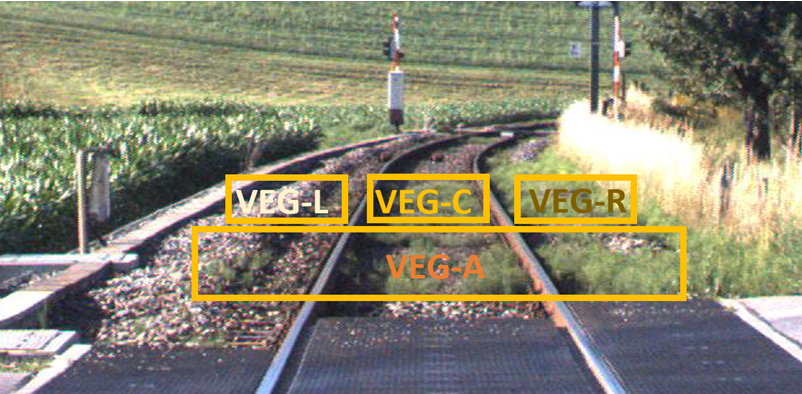
Examined and evaluated are all the areas of an image that can be assigned to the ballast bed. Currently, these areas are detected for green spots. These criteria (image areas, colors, etc.) can be adjusted as desired. When detecting for shades of green, the following states are distinguished:
VEG-A if the entire ballast bed is affected by the green vegetation,
VEG-C if predominantly sleeper bays are affected,
VEG-R if predominantly the ballast at the right head of the sleeper is affected,
VEG-L if predominantly the ballast at the left head of the sleeper is affected.
The results resulting from the image analysis are then used for further consideration of the dewatering situation, the assessment of backwater also regarding the intermediate layers and of course also with regard to the assessment of the degree of contamination and the resulting assessment of the cleanability of the ballast.
The illustration on page 1 shows the data channel „Vegetation“ directly below the multi-display field „Track geometry“ and above the results display of the fractal analysis for the medium wave range. The relevant areas are described on page 1 and shown graphically in the picture above.
The further considerations mentioned there are also complex and are therefore integrated into the new „Machine Learning“ analysis tool BSG-ML.
